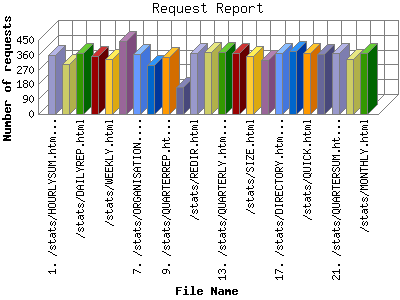
The Request Report identifies the most popular web pages on the site and how often they were accessed.
This report is sorted by number of requests.
| File Name | Number of requests | Number of requests in the last 7 days | Percentage of bytes transferred in the last 7 days | |
|---|---|---|---|---|
| 1. | /stats/HOURLYREP.html | 487 | 3 | 14.78% |
| 2. | /stats/DIRECTORY.html | 471 | 2 | 5.27% |
| 3. | /stats/DAILYSUM.html | 505 | 2 | 6.09% |
| 4. | /stats/QUARTERSUM.html | 487 | 2 | 11.84% |
| 5. | /stats/GENERAL.html | 577 | 2 | 5.92% |
| 6. | /stats/STATUS.html | 401 | 2 | 7.00% |
| 7. | /stats/navfile.html | 340 | 2 | 4.47% |
| 8. | /stats/ORGANISATION.html | 479 | 1 | 3.76% |
| 9. | /stats/DAILYREP.html | 484 | 1 | 4.25% |
| 10. | /stats/HOURLYSUM.html | 465 | 1 | 4.05% |
| 11. | http://www.rodmarc.com/stats/REQUEST.html | 3 | 1 | 3.80% |
| 12. | /stats/QUARTERREP.html | 469 | 1 | 4.97% |
| 13. | /stats/YEARLY.html | 469 | 1 | 2.89% |
| 14. | /stats/QUARTERLY.html | 490 | 1 | 3.30% |
| 15. | /stats/WEEKLY.html | 444 | 1 | 6.47% |
| 16. | /stats/FILETYPE.html | 444 | 1 | 3.29% |
| 17. | /stats/REQUEST.html | 398 | 1 | 3.80% |
| 18. | /stats/QUICK.html | 481 | 1 | 4.05% |
| [not listed: 30] | 3,067 | 0 | 0.00% | |
This report was generated on November 3, 2025 01:56.
Report time frame March 30, 2024 00:01 to November 2, 2025 20:14.
| Web statistics report produced by: | |
 Analog 6.0 Analog 6.0 |  Report Magic 2.21 Report Magic 2.21 |